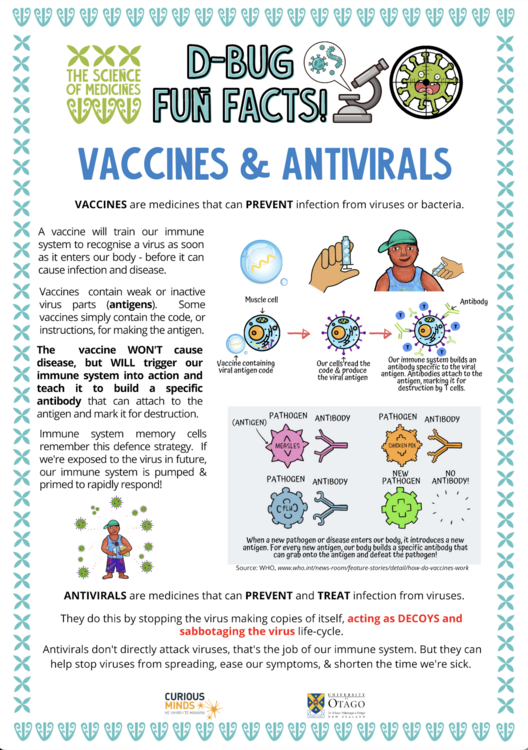
Infographics combine text with graphic images. Their key feature is simplicity – getting a message across in a manner that is easy to visualise and understand.
Infographics consist of three components – the visual component, the content component and the knowledge component. The knowledge component is the insights that come from the text and images.
Infographics have literacy components that students may need support to understand. The article Understanding infographics provides background information on how they are constructed and why they are useful communication tools.
In this activity, students observe and interpret infographics created by The Science of Medicines – Whakatere Waka project to aid student understanding of viruses and vaccines. The activity includes probing questions to help students make sense of the ways in which infographics present information.
By the end of this activity, students should be able to:
- develop literacy skills for interpreting the information in an infographic
- discuss the purpose of an infographic
- discuss how an infographic gets the message across
- discuss information they have gathered from an infographic of interest to them.
Download the Word file (see link below).
Nature of science
Developing visual and numerical literacies such as those used in infographics supports the New Zealand Curriculum’s ‘Communicating in science’ achievement aim. The science capability ‘Interpret representations’ encourages students to think about how data is presented, what the representation tells us and how it gets the message across.
Related content
These resources provide additional information about viruses and vaccines:
There are two unit plans for primary classrooms:
Visit this curated collection: Viruses and the immune system
Activity ideas
These activities also help students learn how to decipher infographics:
Literacy in immunology uses the medium of literacy to explore and consolidate ideas about the immune system and immune response.
Useful link
The Science Learning Hub has curated a number of infographics in our science infographics Pinterest board.
Acknowledgement
The Science of Medicines is a collaboration between the University of Otago and Tūhura Otago Museum and was funded by an Unlocking Curious Minds community engagement grant.


