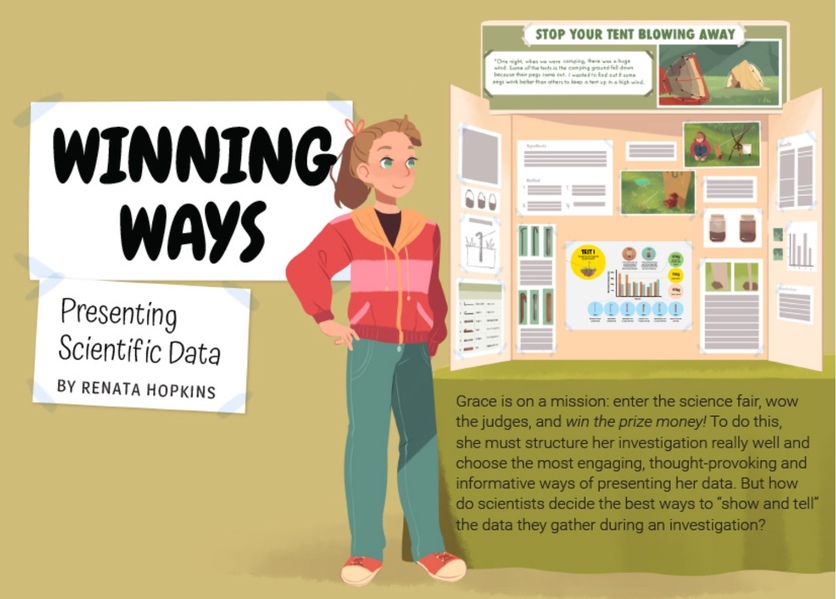
This article tells how Grace uses diagrams, photographs, tables, graphs, infographics and clear science writing to present data for a science fair project. The article is based on a real, prize-winning science fair entry by Wellington student Lauren Kendon.
Teacher support material
Check your school resource area for the article from the 2016 level 4 Connected journal ‘Winning ways: presenting scientific data’ or download the Google slide presentation from Tāhūrangi or order it from the Ministry of Education.
The teacher support material (TSM) can be downloaded from Tāhūrangi (Word and PDF files available). It has an overview of the science capability interpret representations and gives examples of the capability in action.
TSM also has a number of learning activities and associated resource links:
- Critiquing data representations – science
- Critiquing scientific writing – science
- Doing it ourselves – science
- Bouncing back – mathematics and statistics
- The great marble challenge – mathematics and statistics
- Investigating shelters – technology
Related content
Read these stories of some previous New Zealand science fair winners.
Nature of science resources
Check out our entire range of Connected articles here. We’ve curated them by topic and concepts.
See our Science fair investigations Pinterest board for more science fair inspiration.
Useful link
The Connected journals can be ordered from the Down the Back of the Chair website. Access to these resources is restricted to Ministry-approved education providers. To find out if you are eligible for a login or if you have forgotten your login details, contact their customer services team on 0800 660 662 or email orders@thechair.education.govt.nz.
Acknowledgement
The Connected series is published annually by the Ministry of Education, New Zealand.


