Communicating in science and interpreting representations

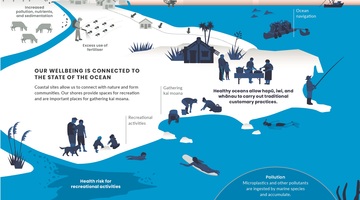
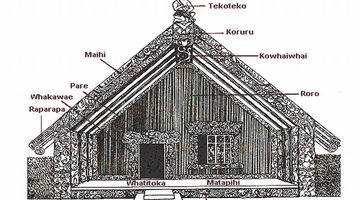
Science knowledge is often communicated through visual representations – graphs, diagrams and infographics. Each type of visual representation has literacy components that students may need support to understand.

The science capability ‘Interpret representations’ encourages students to think about how data is presented, what the representation tells us and how it gets the message across.

Visual representations often summarise or illustrate a complex process. Understanding how to read them is an efficient way to learn new information.

When tackling diagrams or graphs, think how

  • captions provide information about the illustration/image
  • labels often include key content vocabulary
  • directionality - the use of arrows, numbers or letters orient the illustration.

The following resources provide helpful background information.

These activities involve creating or interpreting infographics. They have bilingual components.

Manu

The following graphics feature manu and come from resources curated in Te Tatauranga o ngā Manu Māra o Aotearoa.

Click to add note

Click to add note

Ngā hekaheka

The following graphics feature ngā hekaheka.

Ngā Hekaheka o Aotearoa – kuputaka curates te reo Māori resources from Ngā Hekaheka o Aotearoa.

Click to add note

The Hub features one-off diagrams in reo Māori.

This image is found in the article The star compass – kāpehu whetū.

The graphic featured in the video thumbnail appears in the video.

Below are links to other websites with other infographics. Please email us, enquiries@sciencelearn.org.nz, if know of any others that could be added here: